Most climate graphics we see fall into one of two camps. Either it’s a single scary number with no context, or it’s vaguely hopeful and equally short on detail. The Climate Action Tracker’s “CAT Thermometer” does something more useful – it shows a range of outcomes, tied directly to what governments are doin, and it gets updated a few times a year with live data.
What it shows
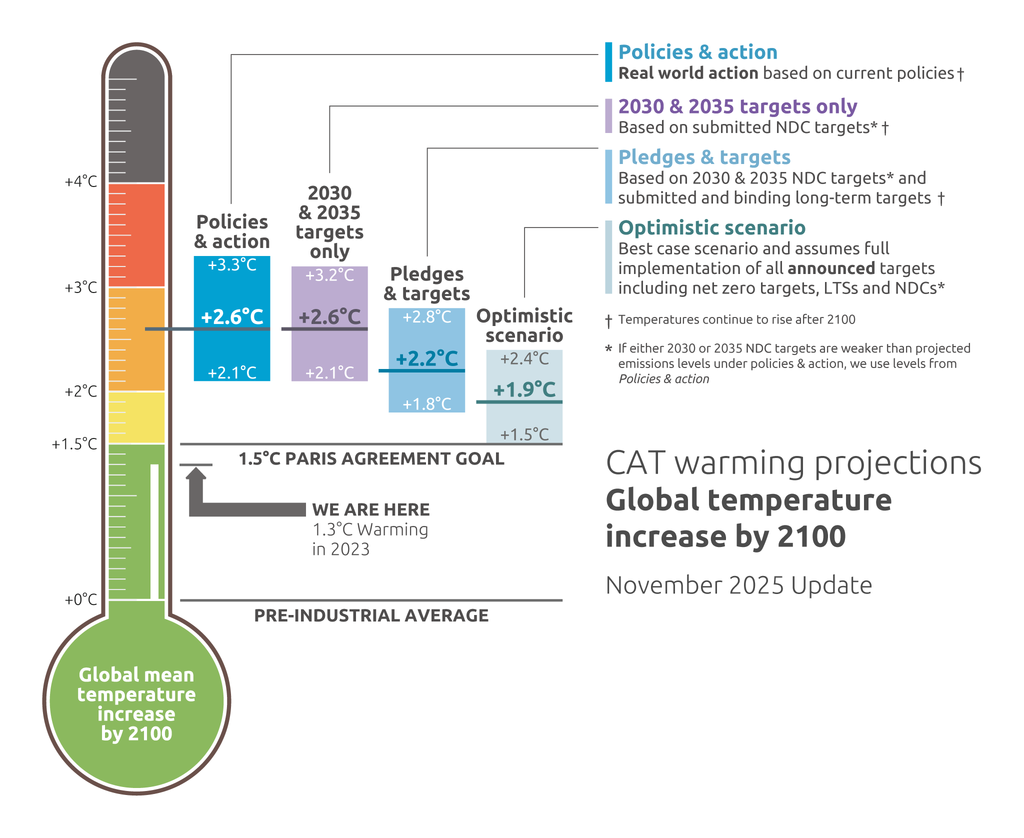
The thermometer sets out four warming scenarios for 2100:
- Current policies: what’s in place now, no further action taken
- 2030 and 2035 targets only: 2.6°C median, with a 66% chance of hitting 2.8°C or higher
- Pledges and targets, including binding long-term goals: 2.2°C median, only a 15% chance of staying under 2°C
- Optimistic net zero scenario: as low as 1.9°C, but only a 50/50 chance of actually landing there
Why it’s worth classroom time
Two things schools can struggle to teach well: scientific projections van come with genuine uncertainty, and that outcomes are still contingent on decisions rather than fixed. This graphic does both without needing too much extra explanation. Every figure on it is a median, meaning a 50/50 chance of the real outcome being worse, and the difference between each scenario is entirely down to policy choices, not physics.
It also crosses subject boundaries more easily than most climate resources. There’s a genuine maths angle (median versus range, probability), a media literacy angle (how a single graphic communicates complex data), and the more obvious geography and citizenship links.
A few ways to use it
- Read it cold first. Give pupils the graphic with no explanation and ask what they think it shows, before revealing the key. Useful for reinforcing that a graph without a key doesn’t mean much.
- Sit with the 50% chance problem. Ask pupils to explain, in their own words, what it means that the “optimistic” 1.9°C figure still only has a 50/50 chance of holding. Then ask why a scientist would choose to report a median rather than a best or worst case number.
- Find out what actually moves the needle. The four scenarios aren’t different physical processes but different sets of decisions. What would need to happen for a country to move from one scenario to the next? This grounds an abstract number in something pupils can connect to real policy and pressure.
- Compare then and now. Older versions of the thermometer are archived on the CAT site. Pupils can compare an earlier update to the current one and ask what happened in between to shift the numbers. Useful for showing these figures move over time rather than being one-off facts.
One thing worth flagging clearly whichever way you use it: even the best-case scenario on the thermometer sits close to, not safely under, 1.5°C, and peak warming during the century can run higher than the 2100 figure shown. “Optimistic” here still means significant warming, just not as much.
Source: Climate Action Tracker (2025). The CAT Thermometer. November 2025. climateactiontracker.org/global/cat-thermometer